Powerful Analytics Across Your Entire Building Portfolio
From a single building to a multi-site campus, Bright Building turns your data into a clear daily action plan, continuous performance monitoring.
Four Steps. Continuous Results.
Bright Building's workflow is designed to require minimal staff time to implement and sustain so you get the insights without adding burden to your team.
Connect
We configure a secure connection to your building data. No staff time is required for implementation.
- ✓ Read-only connection, no write access to your systems
- ✓ Secure cloud delivery
Diagnose
The platform continuously monitors and analyzes your buildings, informed by decades of real-world energy management experience. Issues are identified and prioritized in a simple, intuitive format.
- ✓ Continuous automated analysis, 24/7
- ✓ Root-cause identification, not just symptom alerts
- ✓ Priority scoring based on your facility's specific parameters
Correct
A streamlined workflow keeps each team member informed and focused on their assigned work.
- ✓ Role-based views for managers, directors, and technicians
- ✓ Email notifications with direct links to the relevant issue
- ✓ Integrates with your existing work order ticketing system
Measure
Dashboards and KPIs keep you on top of your entire portfolio. Continuous performance tracking at the building or portfolio level supports daily decisions and long-term planning.
- ✓ Portfolio-level and building-level KPI dashboards
- ✓ Industry-standard M&V methodology with weather normalization
- ✓ Fiscal year, calendar year, and custom baseline reporting
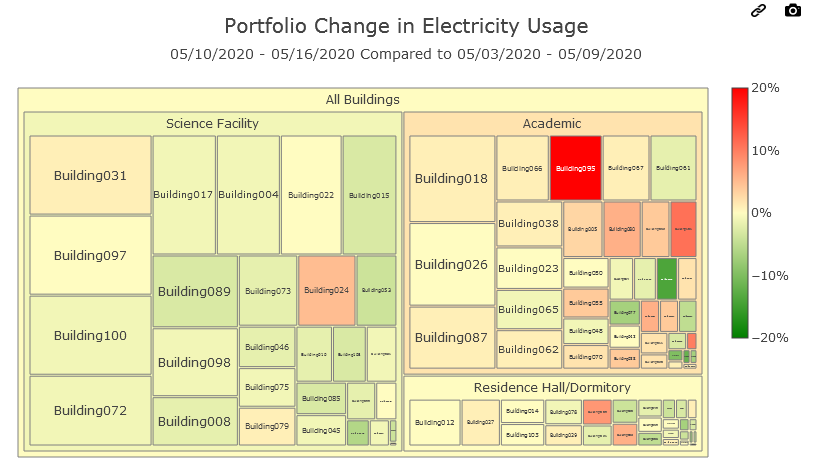
Identify Which Buildings Need Attention at a Glance
Quickly surface which buildings have drifted furthest from their performance baseline. Compare by building type, occupancy profile, or across your entire campus, then drill into the real-time data for any building that warrants a closer look.
- ✓ Side-by-side performance drift comparison across all buildings
- ✓ Filter and group by building type, campus, or region
- ✓ One-click drill-down into live building data and active issues
- ✓ Normalized baselines account for weather, occupancy, and season
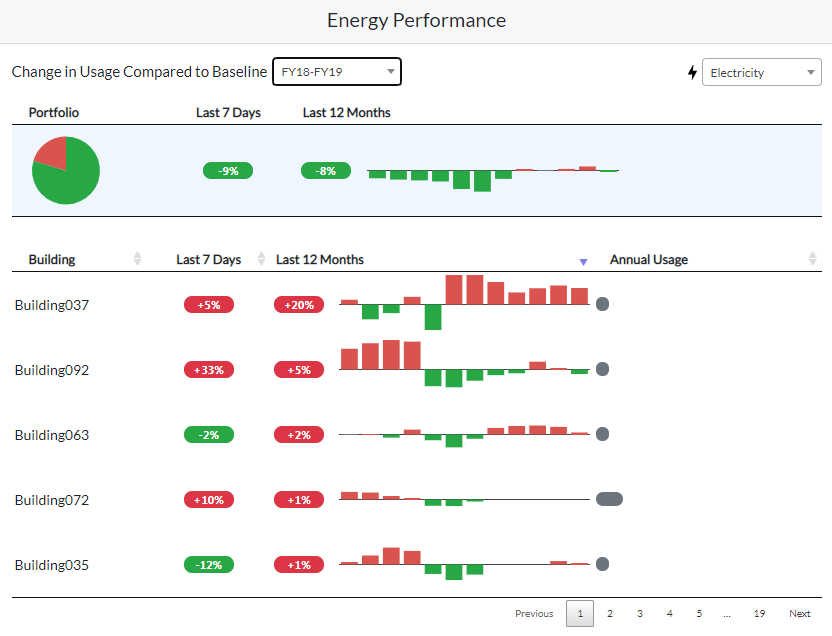
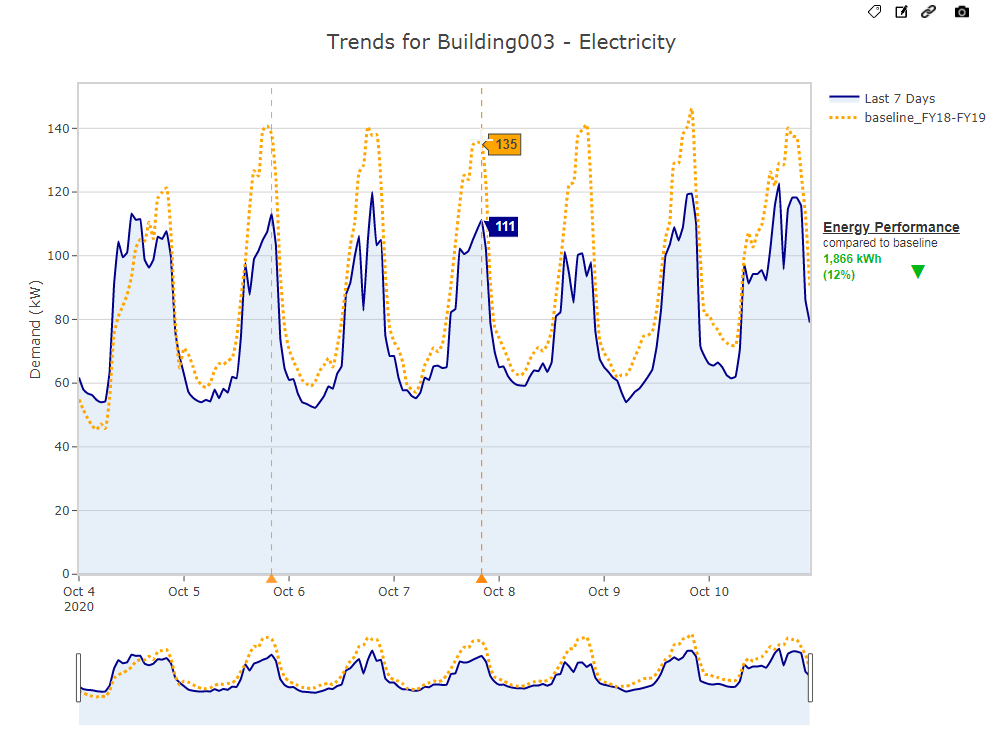
Track Savings Month by Month, Automatically
Instantly see which buildings missed their performance target last week and drill into why. Month-over-month M&V savings tracking keeps your capital projects, ReCx efforts, and operational changes visible and accountable without manual reporting.
- ✓ Real-time ranking of buildings missing performance targets
- ✓ Month-by-month M&V savings for projects and upgrades
- ✓ Continuous baseline monitoring with weather normalization
- ✓ Automatic reporting, no manual data compilation required
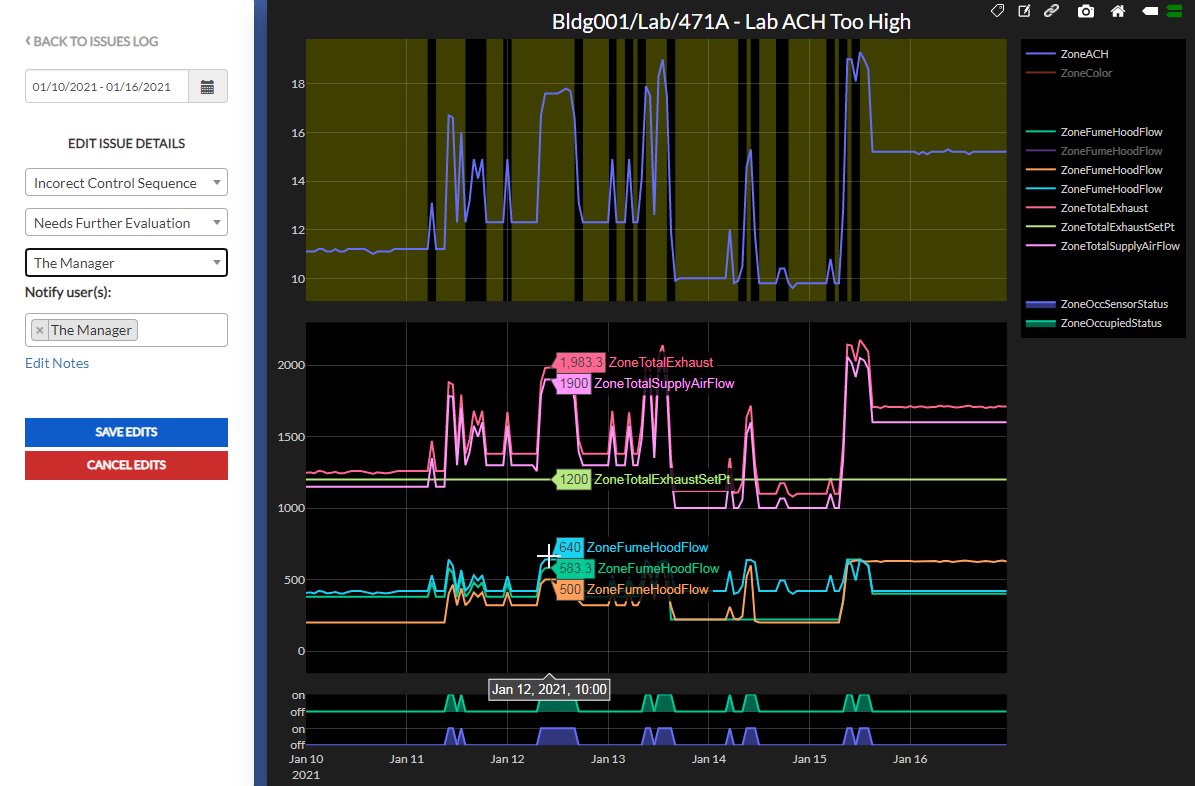
A Workflow Your Whole Team Will Actually Use
Issue-specific diagnostic views help your technicians verify the root cause of a problem before dispatching. The streamlined workflow keeps everyone informed and on task, from the energy manager who flags the issue to the technician who closes it out.
- ✓ Issue-specific diagnostic charts for rapid root-cause verification
- ✓ Collaborative workflow with status tracking and assignments
- ✓ Email notifications with direct links to the active issue
- ✓ Seamless integration with your work order ticketing system
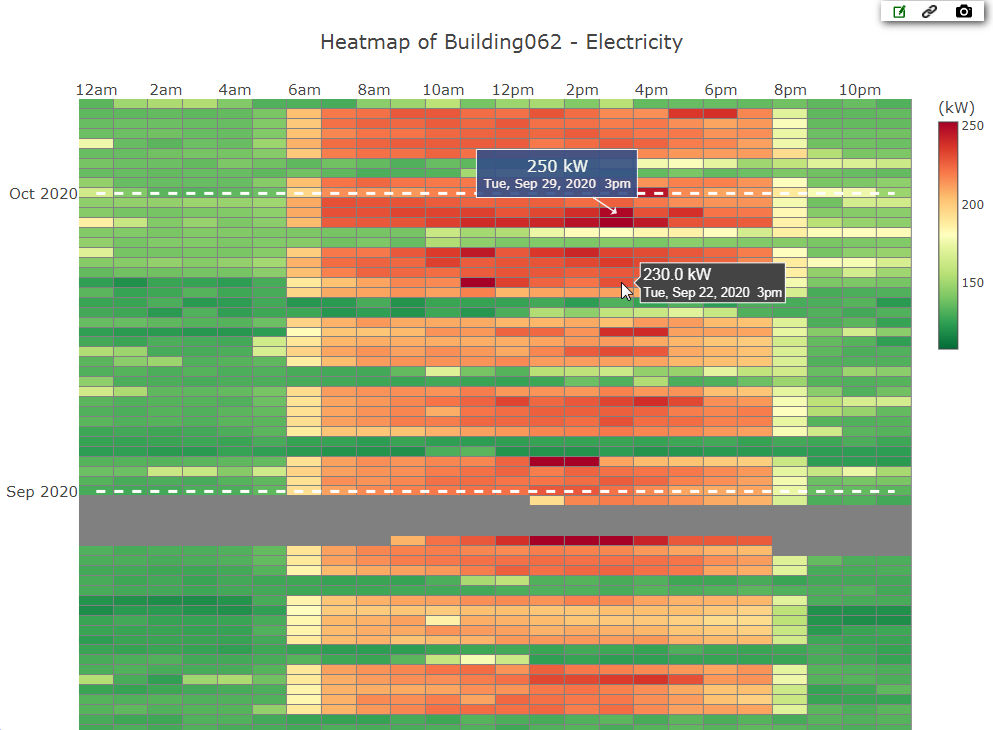
Get Control Over Demand Charges and Operating Schedules
Demand charges can represent 30–50% of a commercial electric bill, yet most facilities have limited visibility into when and why peaks occur. Bright Building's heatmap view makes demand spikes visible and shareable in a single click.
- ✓ Visual heatmap of demand patterns by hour, day, and month
- ✓ Pinpoint demand spikes and share findings with your team instantly
- ✓ Identify buildings running outside their intended occupancy schedule
- ✓ Supports demand response program evaluation and enrollment
Prove the Savings for Any Period, Any Project
Whether you're reporting to a board, a sustainability committee, or your own finance team, Bright Building's M&V engine generates defensible savings reports for any reporting period, automatically and to industry standards.
- ✓ Instant savings reports for any fiscal or calendar period
- ✓ Automatic and custom baseline creation for projects and ReCx efforts
- ✓ Industry-standard M&V methodology accounts for weather, time-of-day, seasons, and holidays
- ✓ Supports ENERGY STAR, LEED, and ESG reporting requirements
One Platform. Every Role. Every Building.
Facility Directors
Portfolio-level KPI dashboards and M&V savings reports give leadership the visibility they need without drowning in operational detail.
Energy Managers
Daily prioritized issue lists, market-timed analysis, and demand charge tracking make energy management proactive instead of reactive.
Facility Technicians
Clear issue assignments, root-cause diagnostics, and work order integration mean technicians spend time fixing problems, not finding them.
Sustainability Teams
Automated M&V reporting, ENERGY STAR benchmarking support, and ESG-aligned performance tracking built directly into the platform.
Want to See How Our Platform Can Help You?
We'll walk you through a live demo using your facility type as the example, so you can see exactly what Bright Building would surface for your buildings.